En este post vamos a utilizar un Metro M4 AirLift (WiFi) fn-1 con una pantalla ePaper / eInk fn-2 de 2.7” con capacidad para renderizar en tres colores (Tri-Color) para crear un seguidor de precios de ciertas monedas Crypto durante las últimos 24 horas, todo utilizando Arduino.
Aclaro que hace mucho que no trabajo ni con circuitos ni con Arduino, por lo que el código puede que pueda mejorarse, pero como hay tan pocos ejemplos creo que a alguien le podría ser de utilidad.
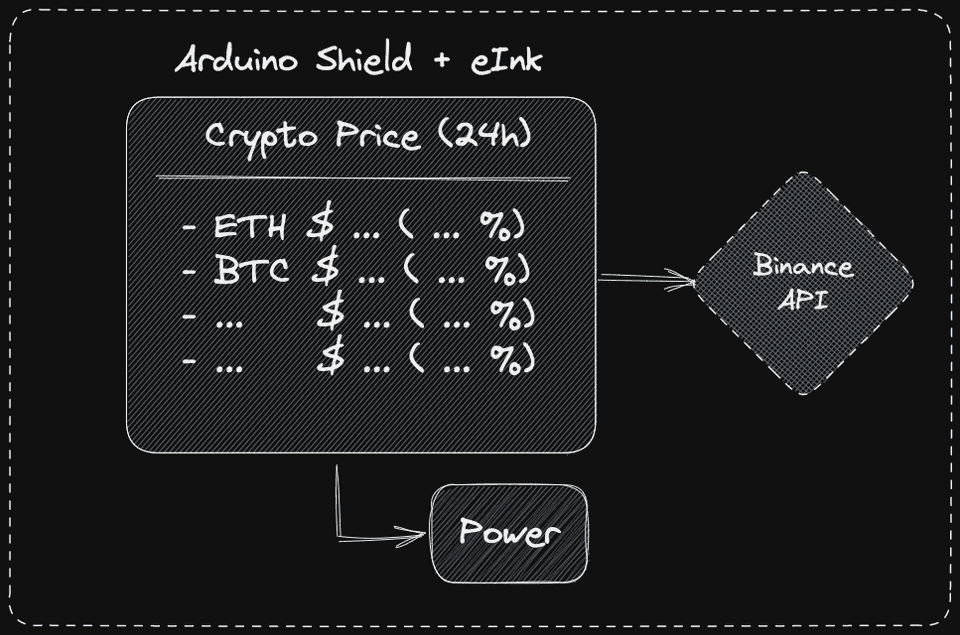
#.La idea
La idea es simple, utilizaremos el Metro M4 Airlift, programado con Arduino, para hacer una llamada al API de Binance y buscaremos los cambios de una lista de monedas crypto (como ETH, IOTA, etc.) cada cierto tiempo.
Con la ayuda de Arduino, obtendremos cada uno de esos valores y los convertiremos en un resultado en formato JSON fn-3 y los desplegaremos en la pantalla eInk. El beneficio de la pantalla eInk es que utiliza muy poca energía, en comparación con una pantalla LCD. Estas son las pantallas que podemos ver en un dispositivo como el Kindle de Amazon.
La ventaja de utilizar el Metro M4 Airlift (WiFi) es que tiene conectividad a través de la red, a través de WiFi, por lo que no es necesario tener el dispositivo conectado a nuestra computadora para que funcione y podemos utilizar una pequeña batería para darle energía tanto al Metro M4 como a la pantalla eInk.
Nota: el Metro M4 se puede conectar a cualquier fuente de 5V, por un cable micro-usb. Por ende, lo podemos conectar a un banco de batería recargable convencional.
Como la pantalla que utilizamos es de tres colores (blanco/nada, negro, rojo), si el valor ha cambiado para negativo durante las últimas 24 horas, lo desplegaremos en color rojo, de lo contrario en color negro.
Adicionalmente mostraremos un pequeño título y un separador en la parte superior de la pantalla.
#.Librerías que vamos a utilizar
Vamos a utilizar el API de Binance, el cuál no requiere ningún tipo de autenticación para realizar las consultas.
Adicionalmente, para este código vamos a utilizar las siguientes librerías en nuestro código Arduino:
- Adafruit GFX, Adafruit EPD y Adafruit NeoPixel: para comunicarnos con nuestra pantalla.
- ArduinoJSON: para convertir el resultado del request del API de Binance en formato JSON.
- WiFiNINA: para podernos conectar a la red WiFi que tengamos.
#.Conectándonos al WiFi
Para conectarnos a la red, utilizaremos la librería WiFiNINA, la cual está muy bien documentada fn-4. Debemos suministrar tanto el nombre de la red (SSID) como la contraseña y utilizar el resto de la librería.
// ...

#define WIFI_SSID "TU SSID"
#define WIFI_PASSWORD "TU PASSWORD"

// ...
bool connectWifi() {
  Serial.println("Connecting to WiFi...");

  WiFi.setPins(SPIWIFI_SS, SPIWIFI_ACK, ESP32_RESETN, ESP32_GPIO0, &SPIWIFI);

  if (WiFi.status() == WL_NO_MODULE) {
    Serial.println("Communication with WiFi module failed!");
    while (true);
  }

  String fv = WiFi.firmwareVersion();

  if (fv < "1.0.0") {
    Serial.println("Please upgrade the firmware");
  }

  if (WiFi.begin(WIFI_SSID, WIFI_PASSWORD) == WL_CONNECT_FAILED) {
    Serial.println("WiFi connection failed!");
    return false;
  }

  int wifitimeout = 15;
  int wifistatus;

  while ((wifistatus = WiFi.status()) != WL_CONNECTED && wifitimeout > 0) {
    delay(1000);
    Serial.print(".");
    wifitimeout--;
  }

  if (wifitimeout == 0) {
    Serial.println("WiFi connection timeout with error " + String(wifistatus));
    return false;
  }

  Serial.println("WiFi connected!!");

  return true;
}

void setup() {
  // Connect to WiFi
  int retry = 6;
  while (!connectWifi()) {
    delay(5000);
    retry--;

    if (retry < 0) {
      Serial.println("Cannot connect to WiFi, press reset to restart");
      while (1);
    }
  }
}#.Configurando la pantalla
Para configurar la pantalla, vamos a crear una función llamada draw y vamos a hacer una configuración inicial de la pantalla dentro de nuesta función setup:
// ...

// Display configuration
#define SRAM_CS      8
#define EPD_CS       10
#define EPD_DC       9
#define EPD_RESET    -1
#define EPD_BUSY     -1
#define NEOPIXELPIN  40

// 2.7 eInk Display Configuration
Adafruit_IL91874 gfx(264, 176 , EPD_DC, EPD_RESET, EPD_CS, SRAM_CS, EPD_BUSY);
Adafruit_NeoPixel neopixel = Adafruit_NeoPixel(1, NEOPIXELPIN, NEO_GRB + NEO_KHZ800);

void draw() {
  setupDisplay();
  gfx.setFont();
  gfx.setTextColor(EPD_BLACK);
  gfx.setTextSize(2);
  gfx.setCursor(8, 4);

  // This will create:
  // CRYPTO PRICE
  // ------------
  gfx.print("PRICE CHANGE (24h)");
  int maxLineWidth = gfx.width() - 8;
  gfx.drawLine(8, 22, maxLineWidth, 22, EPD_BLACK);

  // Finished drawing
  gfx.display();
  Serial.println("display update completed");

  gfx.powerDown();
}

void setup() {
  // Connect to WiFi
  // ...

  // Setup display
  neopixel.setPixelColor(0, neopixel.Color(0, 0, 0));
  neopixel.show();
  gfx.begin();
  Serial.println("ePaper display initialized");
  gfx.clearBuffer();
  gfx.setRotation(2);

  // Draw
  draw();
}
Con este código hasta ahora ya hemos podido:
- Conectarnos a la red WiFi
- Configurar la pantalla
- Desplegar en la pantalla un título con el texto “PRICE CHANGE (24h)”
Ahora nos quedaría hacer la ejecución del API de Binance y desplegarlo en la pantalla.
#.Ejecutar el API de Binance y mostrar el resultado en la pantalla
Tenemos que considerar algunas cosas a la hora de ejecutar el API de Binance y es que debemos comparar el precio de una crypto contra otra crypto, idealmente un stable coin, como USDT (Tether) o USDC.
Es decir, si vamos a ver el valor de 1 BTC, lo tenemos que analizar vs. el valor de 1 USDT. Por consiguiente, la URL para realizar la consulta a Binance se vería de la siguiente forma:
https://api.binance.com/api/v1/ticker/24hr?symbol=BTCUSDTY regresará una comparación entre 1 BTC vs. 1 USDT durante las últimas 24 horas. Dicho esto, nuestro código se compondrá de dos otras funciones, más algunas modificaciones a la función draw() que escribimos anteriormente:
// Other constants
const char* restApiHost = "api.binance.com";
WiFiSSLClient client;

// Ticker Display Positions
int tickerX = 8;
int tickerY = 30;
int tickerYMargin = 20;

String getTickerApiUrl(String ticker) {
  String apiUrl = "https://api.binance.com/api/v1/ticker/24hr?symbol=" + ticker;

  return apiUrl;
}

void getUrlResponseForTicker(String ticker) {
  String result;

  client.stop();

  Serial.println("Getting data for ticker:" + ticker);

  if (client.connect(restApiHost, 443)) {
    client.println("GET " + getTickerApiUrl(ticker) + " HTTP/1.1");
    client.println("Host: api.binance.com");
    client.println("Accept: application/json");
    client.println("User-Agent: Mozilla/4.0 (compatible; esp8266 Lua;)");
    client.println("Connection: close");
    client.println();

    while (client.connected()) {
      if (client.available()) {
        char c = client.read();
        // Serial.write(c);
        result += c;
      }
    }

    client.stop();
    Serial.println("Disconnected");

    // Payload
    // --------
    // The payload will be represented by everything contained between
    // the first `{` and the last `}` received from the service.
    int start = result.indexOf('{');
    int end = result.lastIndexOf('}');
    String body = result.substring(start, end + 1);

    // After payload is received, we can transform it to a JSON doc
    DynamicJsonDocument doc(4000);
    deserializeJson(doc, body);
    String symbol = doc["symbol"];
    String priceChange = doc["priceChange"];
    String priceChangePercent = doc["priceChangePercent"];
    float priceChangeNumber = priceChange.toFloat();
    Serial.println(symbol);
    gfx.setCursor(tickerX, tickerY);

    // If the value is negative, we need to set it to be red
    // since the value has decreased on the last 24H
    if (priceChangeNumber < 0) {
      gfx.setTextColor(EPD_RED);
    }

    gfx.print(symbol.substring(0, 3) + ": " + priceChange.toFloat() + " (" + priceChangePercent.toFloat() + "%)");
    gfx.setTextColor(EPD_BLACK);
    gfx.display();
    tickerY += tickerYMargin;
  } else {
    Serial.println(client.status());
    Serial.println("Connection failed");
  }
}

// ...

void draw() {
  // ...

  // Get data
  // --------
  // For getting the data, we need to compare the crypto
  // symbol to a stable coin, for example USDT.
  //
  // Therefore, if we want to compare ETH to USDT, we need
  // to pass ETHUSDT, where the first chars will represent
  // the symbol to be compared, and the rest will represent
  // which symbol to compare it to.
  // Binance API will know how to split this eventually.
  getUrlResponseForTicker("ETHUSDT");

  gfx.powerDown();
}
Ya con esto podemos obtener el cambio de precio de 1 ETH vs. 1 USDT durante las últimas 24 horas y el mismo se desplegará en nuestra pantalla de color negro (si es positivo) o de color rojo (si es negativo).
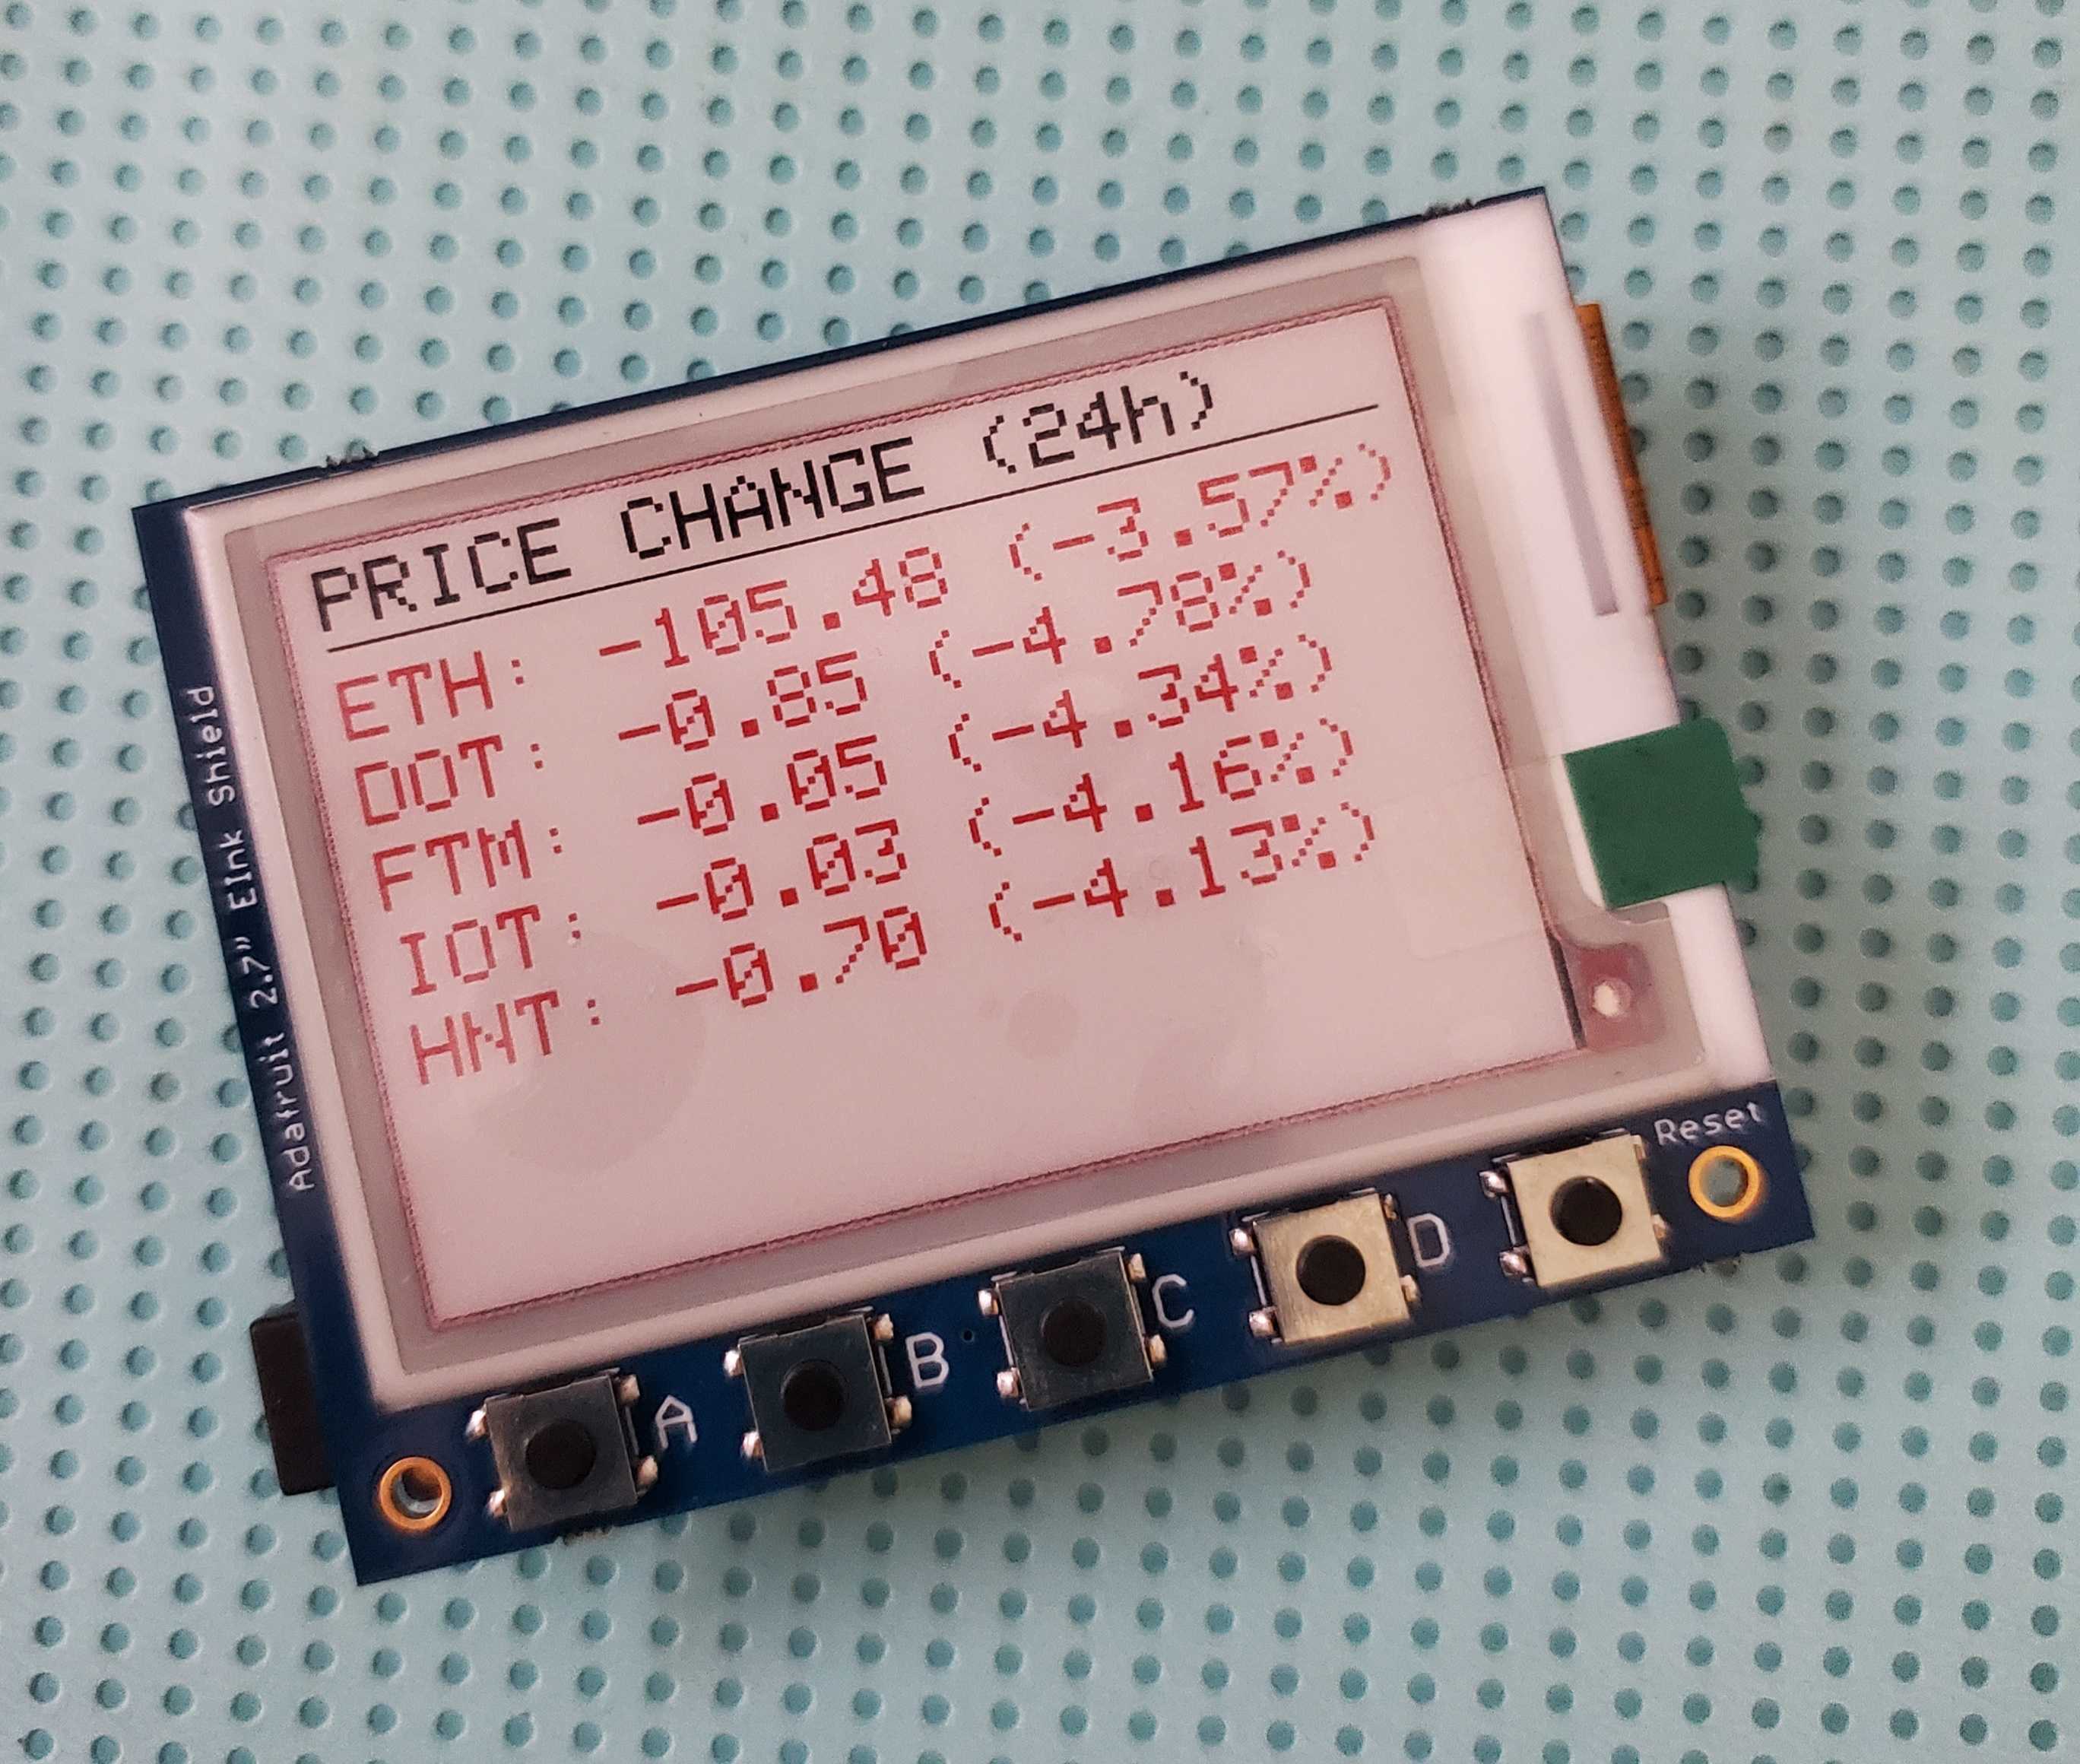
De igual forma podemos agregar más monedas. En mi caso agregué las que mantengo, que serían ETH (Ethereum), DOT (Polkadot), FTM (Fantom), IOTA (MIOTA) y HNT (Hellium).
El resultado final es el siguiente:
- Adafruit M4 Metro Airlift (WiFi)↩
- Adafruit 2.7” Tricolor Display↩
- JavaScript Object Notation↩
- Documentación WiFiNINA↩