
Agile is about improvement and continuous learning, in the end one of the twelve principles of agility states that “At regular intervals, the team reflects on how to become more effective, then tunes and adjusts its behavior accordingly.”
Scrum, the main framework of Agility, is also based on the empirical process of “Transparency, Inspection and Adaptation”, which indicates that the correct way to develop through this framework is through the inspection of data and adaptation through the information generated through them.
Planning releases tends to have an important challenge: estimating or understanding the team’s velocity. Velocity is the amount of points or effort a team can take on within each iteration fn-1. It is important to always agree on a velocity range and not on a closed number for this, since it is very likely that the number will not always be met exactly.
The usual way to calculate this range is through historical values (in the end, we are applying the empirical process) but whenever I develop agile projects with a client or my collaborators, in the first iteration they always ask me the same thing:
And what value do we assign to velocity if this is the first iteration and we have no historical data?
This is always an excellent question, since being the first iteration it is impossible to come up with a value that is based on previous experience. That is why the calculation of speed can always be carried out in one of the following ways:
- Make an estimate based on forecast.
- Do an iteration and use the generated value.
Each method has its advantages (and disadvantages) and even more importantly: each method works best under some criteria. Let’s look at each of them in more depth.
#.1. Estimation based on a forecast
This method is usually the correct method for the first iteration, since there is no historical reference data within which speeds can be “referenced” or evaluated. This method is equally functional when the degree of uncertainty is too high.
The most common way involves a sequential process similar to the following:
- Each initial user story is broken down into different tasks.
- Introduce the stories (ideally broken down into estimated independent tasks) to an iteration.
- Consult the team if they consider they can attack this amount of effort.
This process is repeated until the team considers that it cannot attack any more stories within the iteration or until the team considers that it can only commit to what is assigned to the iteration
#.Focus time
Another alternative to this widely used method is to estimate based on a time-effort conversion (even contrary to some estimation theories). To do this, some calculations are regularly carried out in parallel.
First, we must make a “rough” relationship between the effort points and the hours. Later we must make a table with some calculations for each of the team members:
- Number of hours available within the iteration.
- Focus percentage.
- Total focus hours (Number of hours * Focus percentage / 100).
The focus percentage is related to various studies that show that a person who dedicates 100% of his or her time to a project only focuses between 55-70% on producing for the project fn-2 fn-3.
In particular, I don’t remember if I read anywhere that this value was referred to as a percentage of focus, but it is the term I personally use to call this value. After several years of measuring this value, I have noticed that it is usually around 60% and usually this percentage is lower at the beginning of the project and usually increases when the team is more “comfortable” in the project.
Having calculated the total “focus hours”, we proceed to add the number of hours and multiply it by the “approximate” effort-hours ratio to know the number of points that our team can address (taking into consideration the duration of the Sprint).
Let’s analyze it with an example:
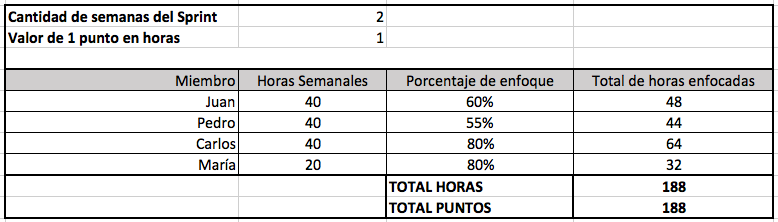
In the previous example, we have 4 people within the Dev Team, for a 2-week iteration and a 1:1 ratio between hours and effort points. Each team member puts in 40 hours of effort each week, except for Maria who is assigned to the project for only 20 hours; I know, I know… in theory it should be assigned solely to the project, but in real life it doesn’t always happen.
Each person has a different percentage of focus. Since Pedro is the Junior of the team, we put a lesser focus on him. Carlos, in contrast, is the one who has the most knowledge about the technology and the project. María, since she is assigned little time on the project and has little uncertainty in her tasks, has a higher percentage of focus.
For each of them we must do the following calculation:
Total Focused Hours = Weekly Hours * Number of Sprint Weeks * Focus Percentage / 100I usually use this format during the first iteration or if the team is having a little trouble working with story points initially (or if team turnover is very high).
#.2. Iteration and generated value
This for me is the most common and correct way to measure speed and can be used in conjunction with the first method (after the first iteration). In my opinion this is the one that should prevail over any other since:
- Real data is being used for decision making.
- Value tends to be realistic (and accurate).
- The best way to predict speed is by evaluating speed.
To develop this method we must execute a series of iterations and measure the points that were served per iteration. Usually you can start with three or more iterations, since this number of iterations allows you to evaluate whether there is a stable number of points served.
Let’s say we do the exercise with 4 iterations and they generate the following results:
- Iteration 1: 14 points
- Iteration 2: 12 points
- Iteration 3: 16 points
- Iteration 4: 14 points
We can set the speed range between 12 (minimum) and 16 (maximum) points based on our experience.
#.Final comments
As final comments I want to clarify that the speed estimate is still an estimate and not a stable value nor a value that can be set in stone. In addition to these two methods, values from past projects can always be used but this is usually not feasible unless it is the same team, it is the same type of project (same purpose, same technologies) and many project variables are maintained. Something that is almost impossible to happen in projects and even less so in software.
When talking about estimates it is always useful to talk about the “Cone of Uncertainty” fn-4 which describes how the uncertainty (as a range) in a project reduces as the project progresses and the team evolves.
I read the concept explained in Agile for the first time to Mike Cohn, in his book “Agile Estimating and Planning”, where (unlike what was explained by the PMI) he made reference to the studies of Barry Boehm (1981) where he detailed a range of uncertainty between 0.6x and 1.6x:
The cone of uncertainty shows that during the feasibility phase of a project a schedule estimate is typically as far off as 60% to 160%. That is, a project expected to take 20 weeks could take anywhere from 12 to 32 weeks. This range of values reduces as time passes, as can be evaluated in the following graph:
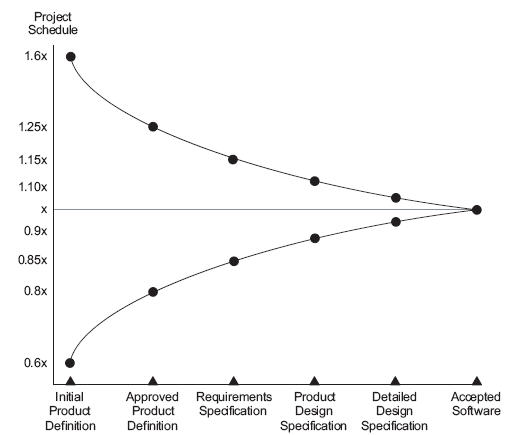
This means that, as time passes, the estimates also reduce uncertainty and will become increasingly more real. This is applicable for both point estimates and velocity estimates.
- https://www.agilealliance.org/glossary/velocity/.↩
- BOEHM, Barry (1981). “Software Engineering Economics”.↩
- GANSSLE, Jack (2004). “Embedded Systems Programming”.↩
- https://es.wikipedia.org/wiki/Cono_de_incertidumbre.↩